Contaminant Comparison Chart
For a complete list of contaminants that PUR filters reduce, please view our Performance Data Sheets here.
|
|
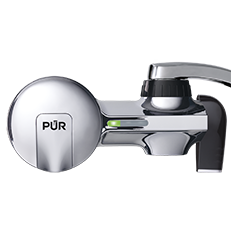
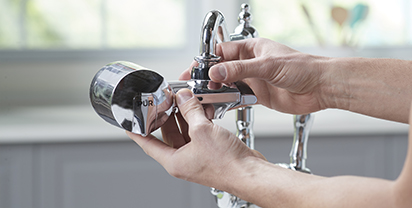
PUR & PUR PLUS FAUCET FILTERS |
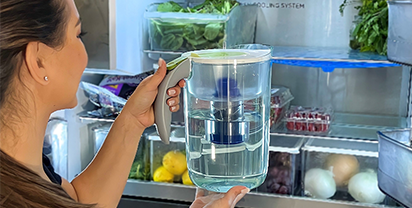
PUR PLUS PITCHER FILTERS |
PUR BASIC PITCHER FILTERS |
|
Vs. Brita* |
 |
 |
 |
| Lead | ✓ | ✓ | |
| Microplastics | ✓ | ✓ | |
| Mercury | ✓ | ✓ | ✓ |
| Chlorine Taste & Odor | ✓ | ✓ | ✓ |
| DEET | ✓ | ||
| TTHM | ✓ |
PUR’s Filtration Systems Are Certified By NSF And WQA For Their Contamination Reduction. WQA certifications as of 5/27/21 for Faucet filter models RF-3375 and RF-9999.
¹ Certified to reduce 10X more chemical and physical substances than Brita’s® leading pitcher filter.
² Certified to reduce 3X more chemical and physical substances than Brita’s® leading pitcher filter.
³ Certified to reduce 2X more chemical and physical substances than Brita’s® leading pitcher filter.
*Versus best-selling Brita® pitcher filter OB03. Brita® is a trademark of Brita LP.
**Like other leading brands, PUR does not filter microbes. As of 3/1/23 Brita® and ZeroWater® were not certified to filter microbes. Brita® is a trademark of Brita LP. ZeroWater® is a trademark of Zero Technologies, LLC..
PUR & PUR PLUS FAUCET FILTERS
|
PUR & PUR PLUS FAUCET FILTERS |
|
|
Vs. Brita* |
|
| Lead | ✓ |
| Microplastics | ✓ |
| Mercury | ✓ |
| Chlorine Taste & Odor | ✓ |
| DEET | ✓ |
| TTHM | ✓ |
PUR’s Filtration Systems Are Certified By NSF And WQA For Their Contamination Reduction. WQA certifications as of 5/27/21 for Faucet filter models RF-3375 and RF-9999.
¹ Certified to reduce 10X more chemical and physical substances than Brita’s® leading pitcher filter.
² Certified to reduce 3X more chemical and physical substances than Brita’s® leading pitcher filter.
³ Certified to reduce 2X more chemical and physical substances than Brita’s® leading pitcher filter.
*Versus best-selling Brita® pitcher filter OB03. Brita® is a trademark of Brita LP.
**Like other leading brands, PUR does not filter microbes. As of 3/1/23 Brita® and ZeroWater® were not certified to filter microbes. Brita® is a trademark of Brita LP. ZeroWater® is a trademark of Zero Technologies, LLC..
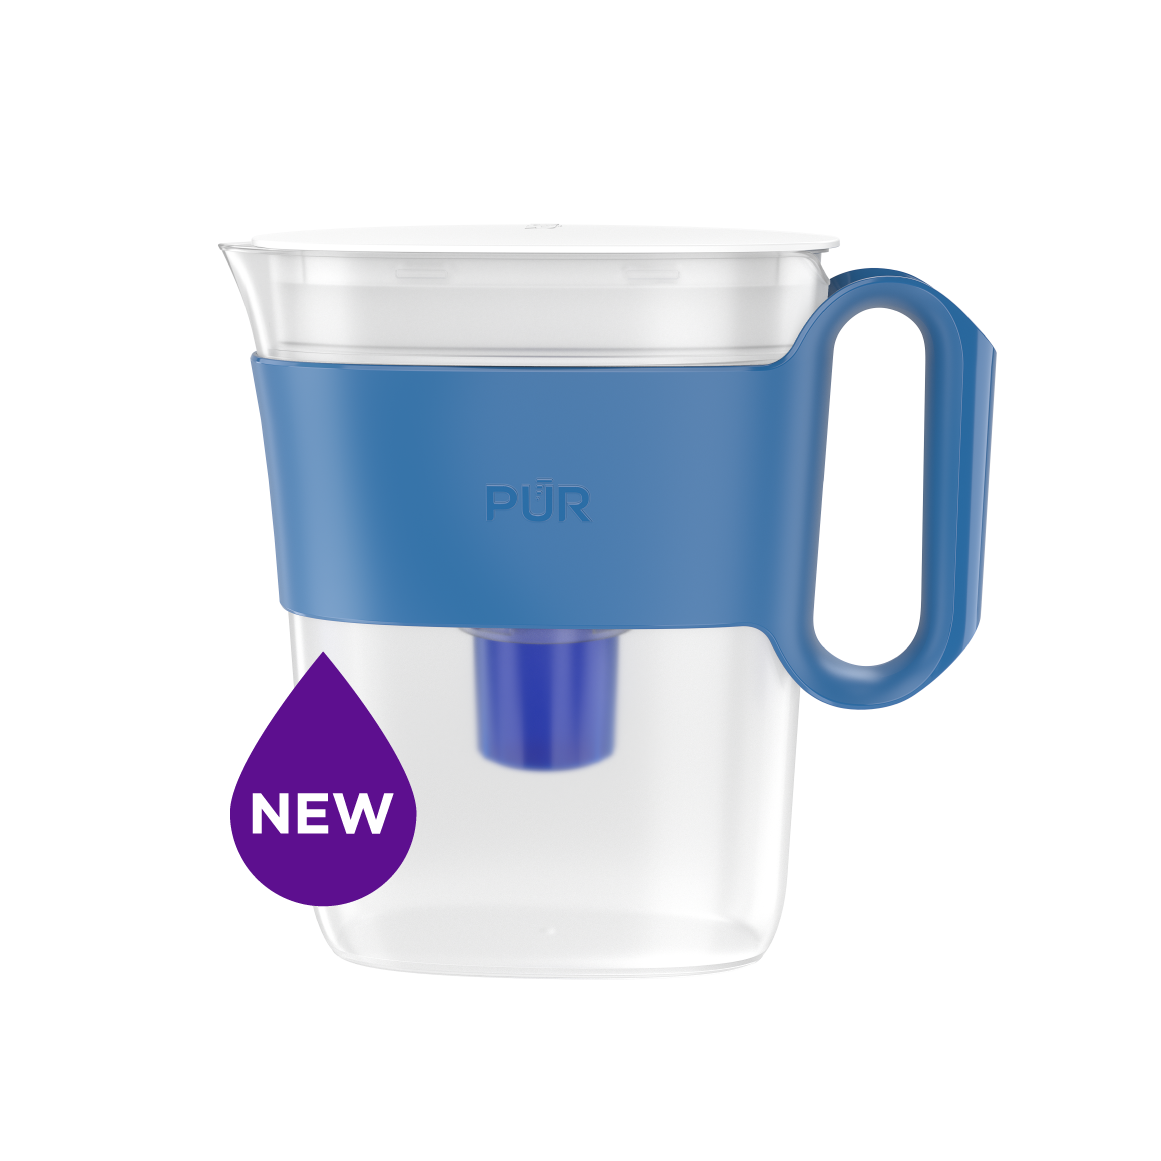
PUR PLUS PITCHER FILTERS
|
PUR PLUS PITCHER FILTERS View Filter |
|
|
Vs. Brita* |
|
| Lead | ✓ |
| Microplastics | ✓ |
| Mercury | ✓ |
| Chlorine Taste & Odor | ✓ |
| DEET | |
| TTHM | |
PUR’s Filtration Systems Are Certified By NSF And WQA For Their Contamination Reduction. WQA certifications as of 5/27/21 for Faucet filter models RF-3375 and RF-9999.
¹ Certified to reduce 10X more chemical and physical substances than Brita’s® leading pitcher filter.
² Certified to reduce 3X more chemical and physical substances than Brita’s® leading pitcher filter.
³ Certified to reduce 2X more chemical and physical substances than Brita’s® leading pitcher filter.
*Versus best-selling Brita® pitcher filter OB03. Brita® is a trademark of Brita LP.
**Like other leading brands, PUR does not filter microbes. As of 3/1/23 Brita® and ZeroWater® were not certified to filter microbes. Brita® is a trademark of Brita LP. ZeroWater® is a trademark of Zero Technologies, LLC..
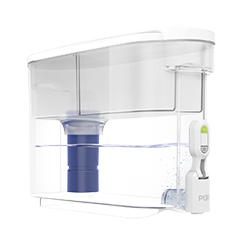
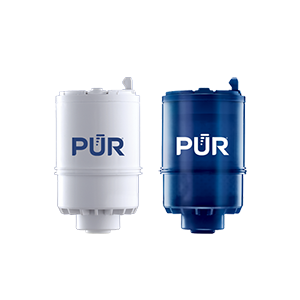
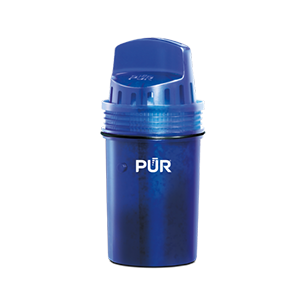
PUR BASIC PITCHER FILTERS
|
PUR BASIC PITCHER FILTERS |
|
|
Vs. Brita* |
|
| Lead | |
| Microplastics | |
| Mercury | ✓ |
| Chlorine Taste & Odor | ✓ |
| DEET | |
| TTHM | |
PUR’s Filtration Systems Are Certified By NSF And WQA For Their Contamination Reduction. WQA certifications as of 5/27/21 for Faucet filter models RF-3375 and RF-9999.
¹ Certified to reduce 10X more chemical and physical substances than Brita’s® leading pitcher filter.
² Certified to reduce 3X more chemical and physical substances than Brita’s® leading pitcher filter.
³ Certified to reduce 2X more chemical and physical substances than Brita’s® leading pitcher filter.
*Versus best-selling Brita® pitcher filter OB03. Brita® is a trademark of Brita LP.
**Like other leading brands, PUR does not filter microbes. As of 3/1/23 Brita® and ZeroWater® were not certified to filter microbes. Brita® is a trademark of Brita LP. ZeroWater® is a trademark of Zero Technologies, LLC..